Have you ever wondered if your favorite fish might hold more mercury than you think? Imagine a chart that shows mercury levels in common fish, measured simply in parts per million (that’s just a tiny amount mixed in, like droplets in the ocean). The chart sorts the fish from the highest mercury levels down to the lowest, so you can quickly spot which ones need a bit more care. With easy-to-read numbers, it helps you pick fish that are tasty and safe, letting you enjoy every bite like a smooth swim in clear water.
Mercury Levels in Fish Chart: Visual Comparison of Key Species
Ever wonder how much mercury might be in the fish you enjoy? This chart is like a friendly guide that shows you the methylmercury levels in many popular fish. It measures mercury in parts per million (ppm), which simply tells you how many bits of mercury mingle with a million bits of fish flesh. For example, if a fish has 1.123 ppm, it means just a tiny bit of mercury is present in every million parts of its meat.
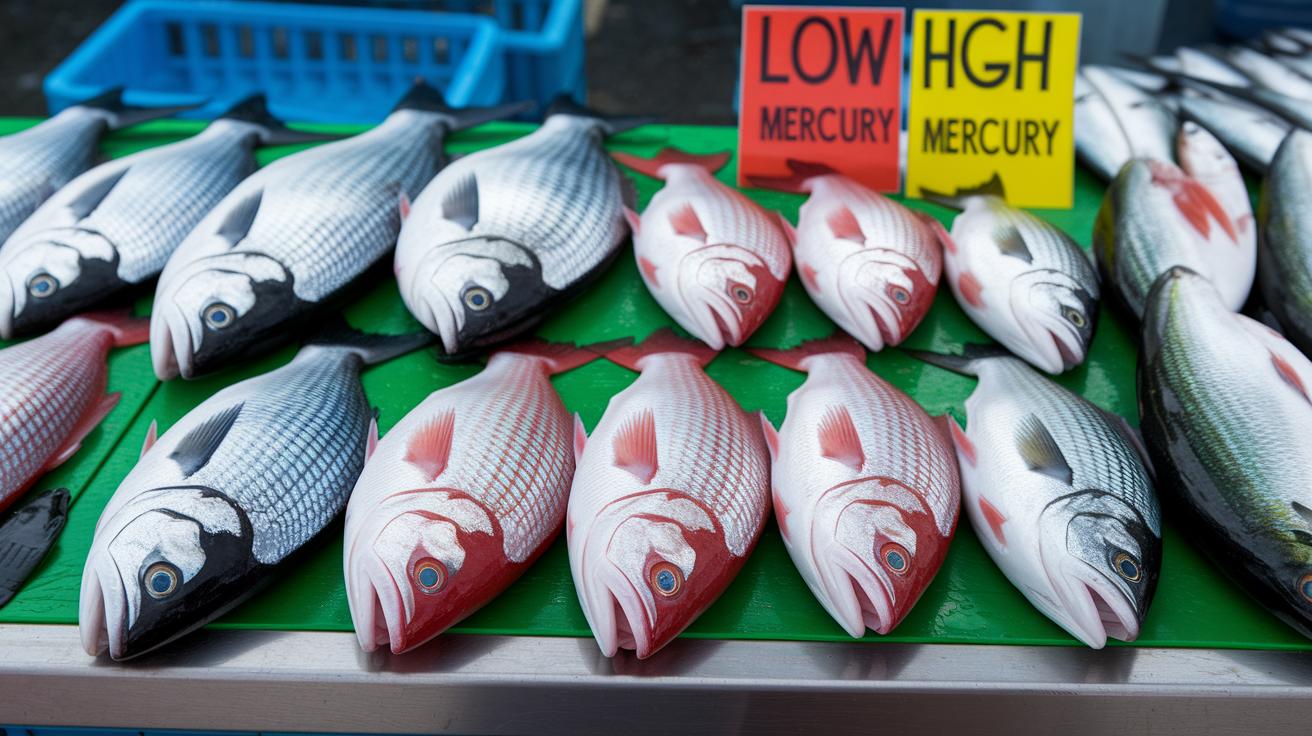
We lined up ten commonly eaten fish from the ones with the highest mercury to those with the lowest. This way, you can quickly spot which fish might need a bit of extra caution and which ones are safer to enjoy more often. To make things even simpler, the chart groups the mercury levels into clear categories: High, Medium, Low, and Very Low.
| Fish Species | Mercury Level (ppm) | Contaminant Category |
|---|---|---|
| Tilefish | 1.123 | High |
| Shark | 0.980 | High |
| Swordfish | 0.800 | High |
| Tuna | 0.320 | Medium |
| Grouper | 0.150 | Medium |
| Cod | 0.111 | Medium |
| Halibut | 0.200 | Medium |
| Mahi-mahi | 0.250 | Medium |
| Salmon | 0.022 | Low |
| Sardines | 0.013 | Very Low |
Tilefish sits at the top with the highest mercury, while sardines float at the bottom with the least. This easy-to-read guide helps you balance enjoyment with safety, much like finding just the right current for a smooth swim.
Interpreting Fish Mercury Chart Data
Methylmercury is the main toxic form measured in fish, and it really helps us figure out which fish are safe to eat. This substance gets into water from natural events like volcanoes and forest fires, as well as from industrial releases. Once it’s in the water, friendly bacteria change it into methylmercury that slowly builds up in fish over time. Bigger, older fish, especially top predators, tend to carry more of it, so these charts help us see which species might be riskier to enjoy.
- PPM stands for parts per million, telling you how many parts of mercury are in one million parts of fish flesh.
- Fish are ranked from those with the highest mercury levels to the lowest.
- The numbers are split into low, medium, and high groups, which show different risk levels.
- Age and size matter, a larger, older fish usually gathers more methylmercury.
- By checking these numbers against FDA and EPA guidelines, you can learn what levels are safe to consume.
Knowing these details is super helpful because it lets you decide how often to include certain fish in your meals while keeping health risks low. It’s almost like understanding the gentle ebb and flow of water before you dive into your favorite tank.
Safe Consumption Guidelines From the Mercury Levels Chart
Mercury in fish is measured in parts per million (ppm), and it helps us know how often we can safely enjoy our favorite seafood. Simply put, fish with lower ppm values are better choices for regular meals. For example, if a fish has very low levels of mercury, you can include it in your weekly diet with fewer worries compared to fish with higher levels.
Agencies like the FDA and EPA have set helpful limits, advising that we keep our daily mercury intake to less than 0.1 µg per kilogram of body weight. This guidance breaks down into straightforward serving suggestions for different groups:
- Adults can safely enjoy 2 or 3 servings a week of low-mercury fish.
- For children, a small portion of 2 to 3 ounces helps keep their exposure low.
- Pregnant women should opt for just 1 serving per month if it’s a high-mercury variety.
- Seniors should follow the adult guidelines, but be extra cautious if they already have health issues.
Keeping these tips in mind is really important. Over time, eating too much fish with high mercury levels can build up in your body and might harm your nervous system, possibly affecting memory or coordination. This is especially worrying for little ones and moms-to-be, whose bodies are more sensitive. By balancing your fish meals according to these guidelines, you can still enjoy all the great benefits of seafood like omega-3 fats and protein, without the risk of too much mercury.
Factors Affecting Mercury Levels in Fish Chart Results

Sometimes, nature itself adds mercury to our waters. Think of volcanoes erupting, forests quietly burning, and factories burning coal. All these events send tiny amounts of mercury into nearby streams and lakes, where it mixes with other natural elements. This mix then starts a slow journey that eventually touches the fish we know and love.
- Volcanoes
- Fossil fuel burning
- Mining runoff
- Atmospheric deposition
Once the mercury enters the water, a hidden process begins. Tiny bacteria in the soft, muddy sediments work away and change this mercury into methylmercury, a form that is very toxic. This bacteria act quietly, making the mercury easier to build up in fish. How fast and how much this happens can change with water temperature and the nature of the sediments below.
As time passes, fish gather more and more of this toxic substance, a process known as bioaccumulation. Larger and older fish have been swimming and feeding for a longer time, which means they often pick up more methylmercury. That's why the big fish at the top of the food chain usually show higher mercury levels compared to their smaller, younger friends.
Mercury Levels Chart Insights for Expectant Mothers
When you're expecting, it's important to be mindful about your fish choices. Methylmercury can easily slip through the placenta and may affect your baby's growing brain. This chart acts like a friendly guide, showing you which fish to dodge and which ones are gentler on your baby.
Think of it like picking the right stream for a swim, a smooth flow keeps everyone safe. Fish such as tilefish, swordfish, and shark are high in mercury and are best avoided. On the flip side, choices like sardines, salmon, and other low-mercury options offer a safer, healthier meal.
First Trimester Advice
| Unsafe Fish | Safe Alternatives |
|---|---|